Language and Content
Success in Social Science
Interpret Data
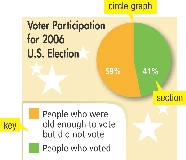
Data is information. You can represent, or show, data in different ways.
| Number | Percent | |
|---|---|---|
| People who were old enough to vote but did not vote | 121,435,000 | 59% |
| table People who voted | 84,387,000 | 41% |

Voter Participation for 2006 U.S. Election
circle graph
section
key
 People who were old enough to vote but did not vote
 People who voted
Listen to the article. Study the circle graph below. Then do the Review.
• Do Americans make good use of their right to vote?
In the United States today, you can vote if you are a citizen and if you are 18 years old or older. You also have to register, or sign a paper saying that you want to vote.
It hasn’t always been so easy to vote. In the Revolutionary War of 1776, Americans fought the British for the right to vote. For almost a hundred years after the war, only white men could vote. Over the years, several amendments to the United States Constitution have expanded the right to vote:
• In 1870, after the Civil War, the 15th Amendment gave all men of any race the right to vote.
• In 1920, the 19th Amendment gave women the right to vote.
• In 1971, the 26th Amendment lowered the voting age to 18.
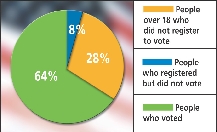
Some citizens who are 18 or older do not take the time to register to vote. Others register, but do not vote. Study the circle graph to see data for a typical year.

Voter Participation for 2004 U.S. Election
 People over 18 who did not register to vote
 People who registered but did not vote
 People who voted
1. Check Your Understanding Who can vote in the United States today? Do Americans use their right to vote? Explain your answer.
2. Vocabulary How does a circle graph help you to compare data?
3. Use Circle Graphs Compare the data for the 2004 election and the 2006 election. In which year did a higher percentage of people vote? How can you tell?