Focus on Genre: Social Science Textbook
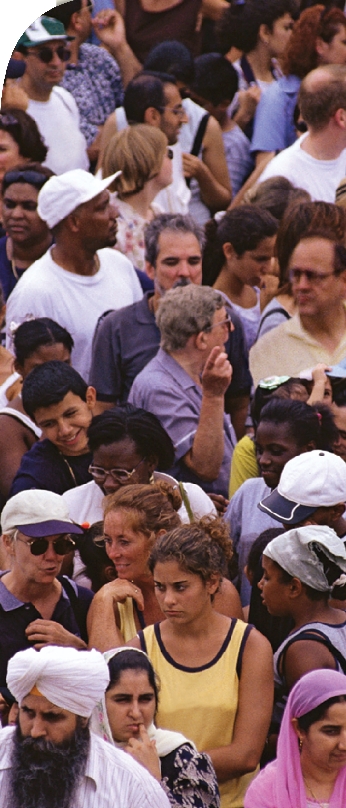
A social science textbook gives information about real people, places, and events.
It often explains why certain events happened. Graphs in a textbook help provide important information in a visual way.
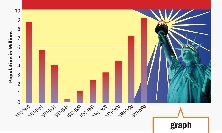
20th Century Immigration in the United States (by decade)
graph
Your Job as a Reader: Reading Strategy: Visualize
As you read, write what you visualize on sticky notes and place them next to the text. Then try to make a sketch of what you “see” and “hear.”
What I Read
Many Asian Americans celebrate the Chinese New Year with special food and fireworks.
I hear loud fireworks and smell delicious food.