Focus on Genre: Science Feature
A science feature is expository nonfiction about the study of the natural world. Many science features include graphs, charts, maps, and other text features that show information visually. Graphs show how two or more things are related.

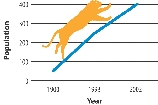
Siberian Tiger Population
This graph shows how the number of Siberian tigers (Population) changed over time (Year). Points on the line show the tiger population in a particular year.
Your Job as a Reader: Reading Strategy: Visualize
As you read, make notes about sensory details. Use them to help you visualize.
