Language and Content
Success in Mathematics
Learn About Bar Graphs
A bar graph compares numbers. It is a good way to see information quickly.
This bar graph shows how many students stay in touch with their friends by visiting, using the telephone, using e-mail, and text messaging.
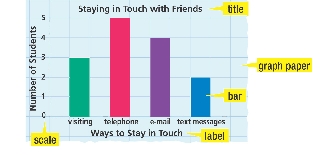
Staying in Touch with Friends
title
graph paper
bar
scale
label
Read the instructions. Then do the activity.
You will need: a data chart, graph paper
1 Make a Survey
Interview several students. Ask: “Which languages do you know how to speak?” Record the names and languages in chart.
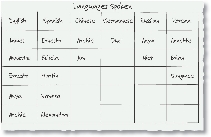
Languages Spoken
2 Create a Tally
Count the number of students in each category.
3 Make a Bar Graph
• Label the bottom line of your graph: Languages Spoken.
• Label the scale: Number of Students.
• Draw the bars to make the graph.
• Write a title.
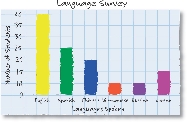
Language Survey
1. Look at your chart. What do the numbers tell you?
2. Is the total number of students across the languages the same as the number of students you interviewed? If not, why?
3. Why is a bar graph a good way to see the results of your survey?