Language and Content
Success in Science and Mathematics
Learn About Line Graphs
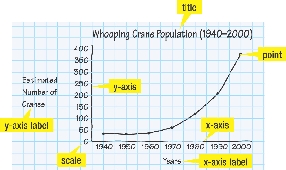
A line graph shows how something changes over time.

Whooping Crane Population (1940–2000)
title
point
y-axis
y-axis label
x-axis
scale
x-axis label
Listen to the article. Study the picture and the graph below. Then do the Review.
• Can the whooping crane be saved?
In the 1800s, there were hundreds of whooping cranes in North America. Then the cranes became endangered. Many were hunted. Many of the wetlands where they lived were drained and turned into farms. By the 1940s, only a few whooping cranes were left.

The whooping crane is beautiful. It is white with red and black on its head. It has long, thin legs and a long beak.
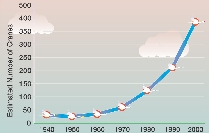
Scientists are working hard to save these cranes. Each spring, whooping cranes lay two eggs and raise only one chick. Some scientists take the extra egg and hatch the chick. Then they release the chick into the wild. This work has helped increase the number of whooping cranes. By 2000, there were about 400 whooping cranes in North America.

Whooping Crane Population (1940–2000)
1. Check Your Understanding Why did whooping cranes become endangered?
2. Vocabulary Name the parts of a line graph.
3. Use Line Graphs About how many whooping cranes were counted in 1950? In 1990? In what year were there about 125 whooping cranes?