MATH
Researchers collect data to find out how the country grows and changes. The data shows how many people
• live in each city and state
• go to school
• work in offices, restaurants, hospitals, and other places.
Government leaders can use the data to plan for the future. They use it to figure out how many schools or roads to build, for example.

Researchers collect data about how many people live in cities like New York.
1 Conduct Research Find out how your community has changed. Use the Internet to collect data.
Internet InsideNG.com
 Find out the population of your town now and in past years.
2 Make a Graph Use the data to make a graph like this one.
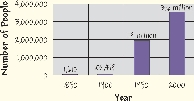
Bar Graph
Population of Los Angeles
3 Report Your Findings Display your graph for the class. Tell what it shows. Has your town grown quickly? How do you know? Speak clearly, and make eye contact with your classmates. Explain where your information comes from.